
JVM Young generation tuning
26 Sep 2019Diagnosed an interesting performance issue recently with Garbage collection.
A process in production was running very slow and when I looked at the JVisualVM monitor, the CPU and memory graphs looked like this:
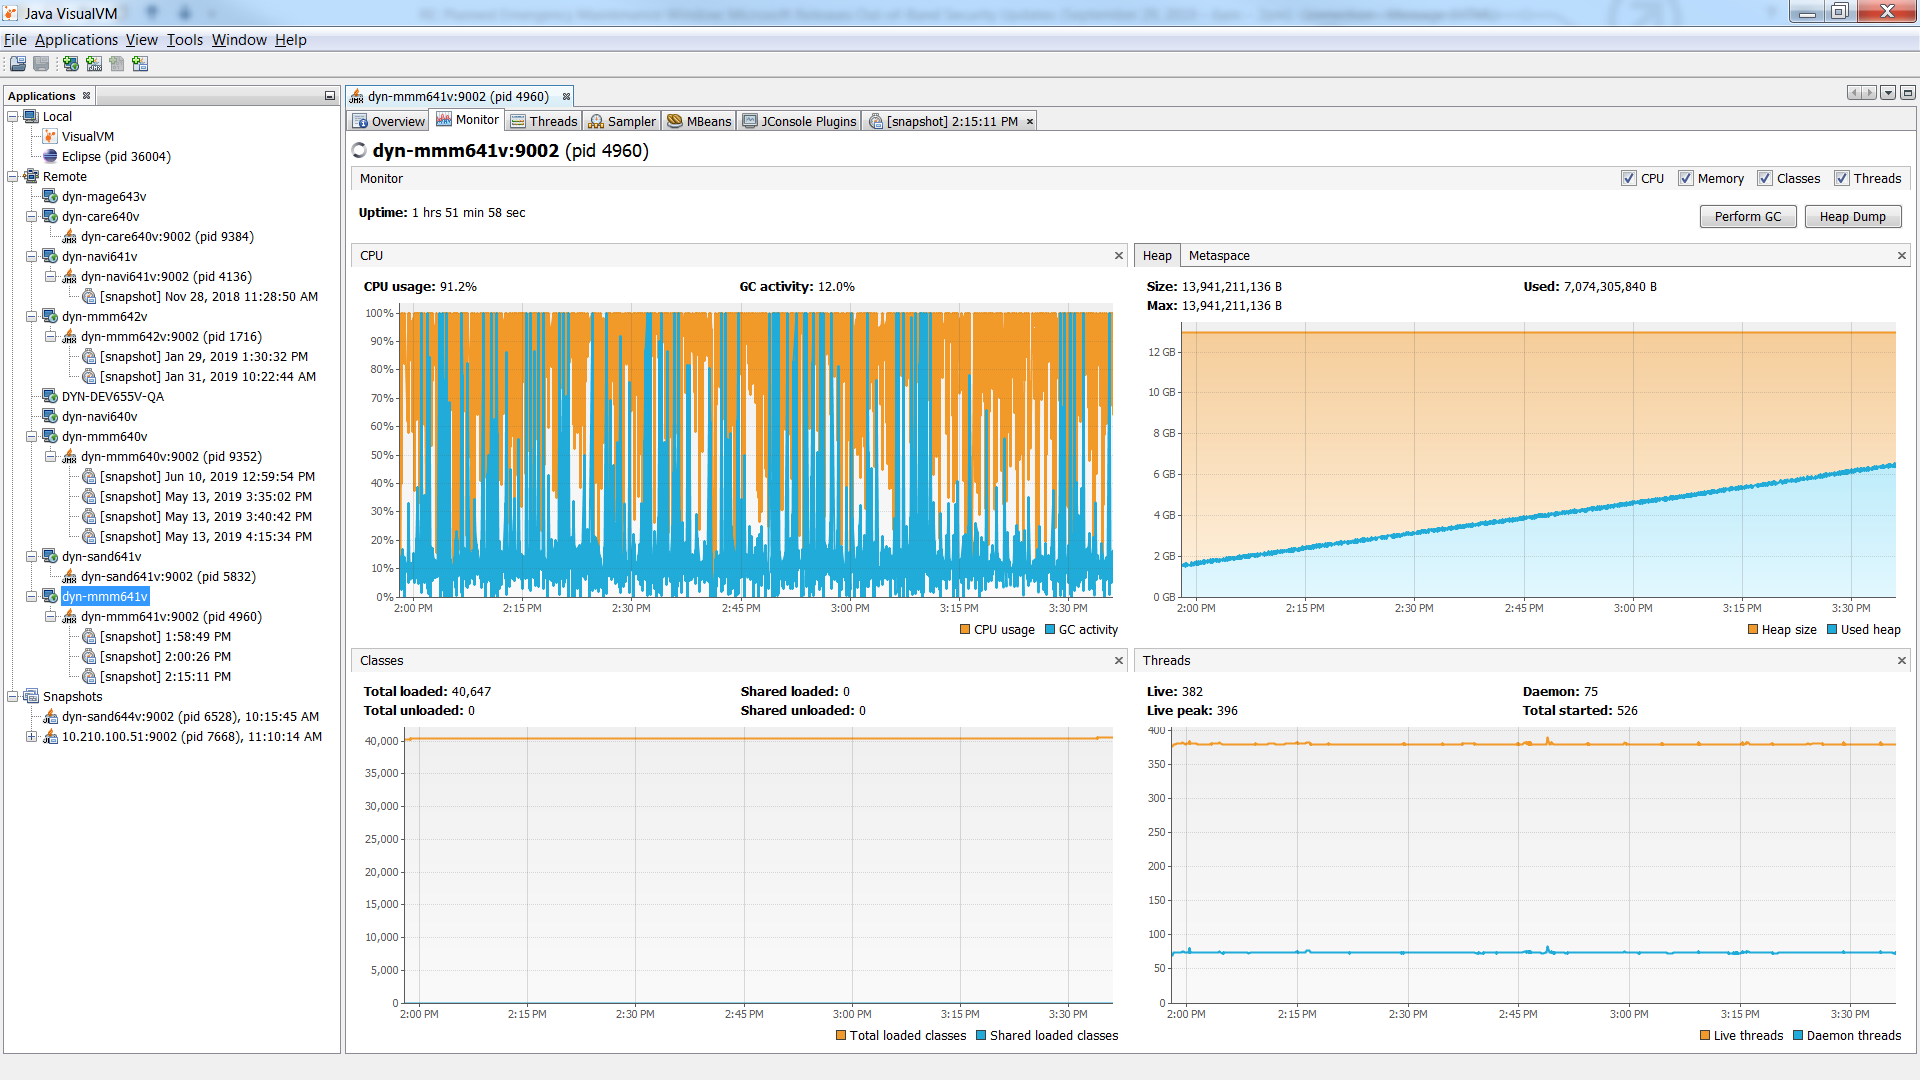
If you look at the CPU activity, the spikes in blue are actually Garbage collection cycles. It was almost consuming more processing time than the actual process. If you look at the memory map on the right, we are not even close to reaching the heap max. It was confusing as to why this was happening and so I read up on GC in Java 8 and remembered young generation vs old generation:
In short young generation is where the objects get created and then get transitioned to the old generation when the young generation reaches a capacity threshold. There are various stages within the young generation itself which cause minor GC cycles to run, but when objects move from the young generation to old, a major GC cycle runs(blue spike above). Clearly there were a lot of blue spikes above which indicated that objects were being transitioned very frequently. This implied that the young generation was not large enough(default is 1/4th of the heap). To tune this, I read further:
Using the setting of XX:NewRatio=2(YG is 1/3rd and OG is 2/3rd of the heap. YG should never be larger than OG), I got the below Monitor map:
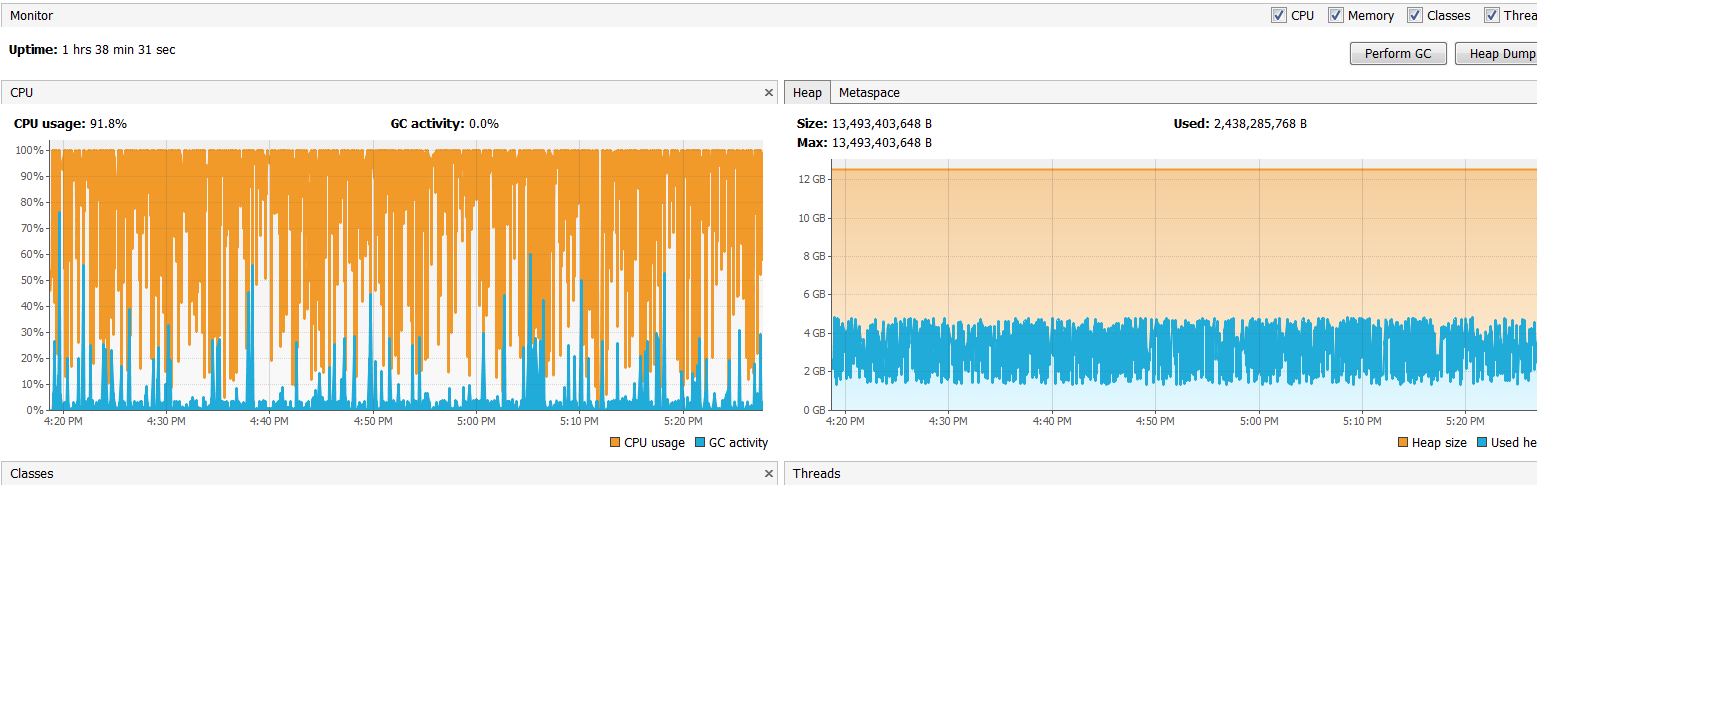
You will notice that there is a lot of activity, but its mostly orange(good) and the blue spikes are small and the big ones are limited. This means that GC is not occupying a large portion of the processor cycles and allowing the process to use as many resources as it needs to. This doubled the performance(300 messages per second to over 600 per second) and the process remained stable. What is also interesting is that the memory graph has a lot of jitter. This is because the heap is allowed to grow in the young generation and then cleaned. Another curious effect was that the memory consumption remained very stable where as with the previous configuration, heap consumption kept growing rapidly.